
Sourcing Intelligence
Make better sourcing decisions with real market data
Use real transaction and pricing data to support smarter API sourcing decisions.
4K+
APIs covered
3,7M
Transactions
6
Years of data
Search API market data
Pricing, trade volumes, and recent transactions, all in one place.

The sourcing reality
API pricing and market conditions are often difficult to validate.
Sourcing decisions are frequently based on limited quotations, fragmented market knowledge, or outdated references, making negotiations and internal alignment harder than they should be.
What you get
Pharmaoffer sourcing intelligence gives you direct access to structured API market data designed for sourcing decisions.
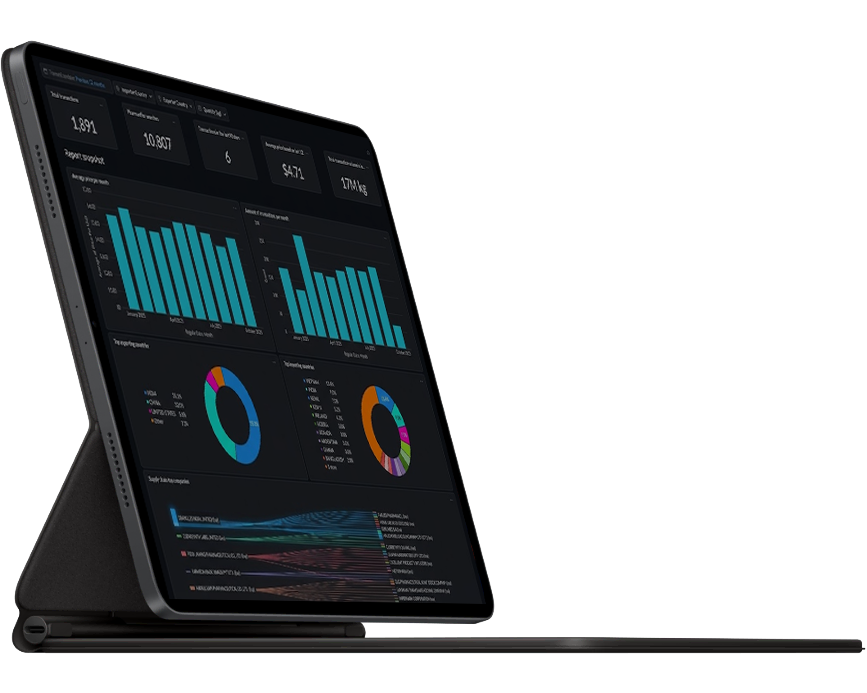
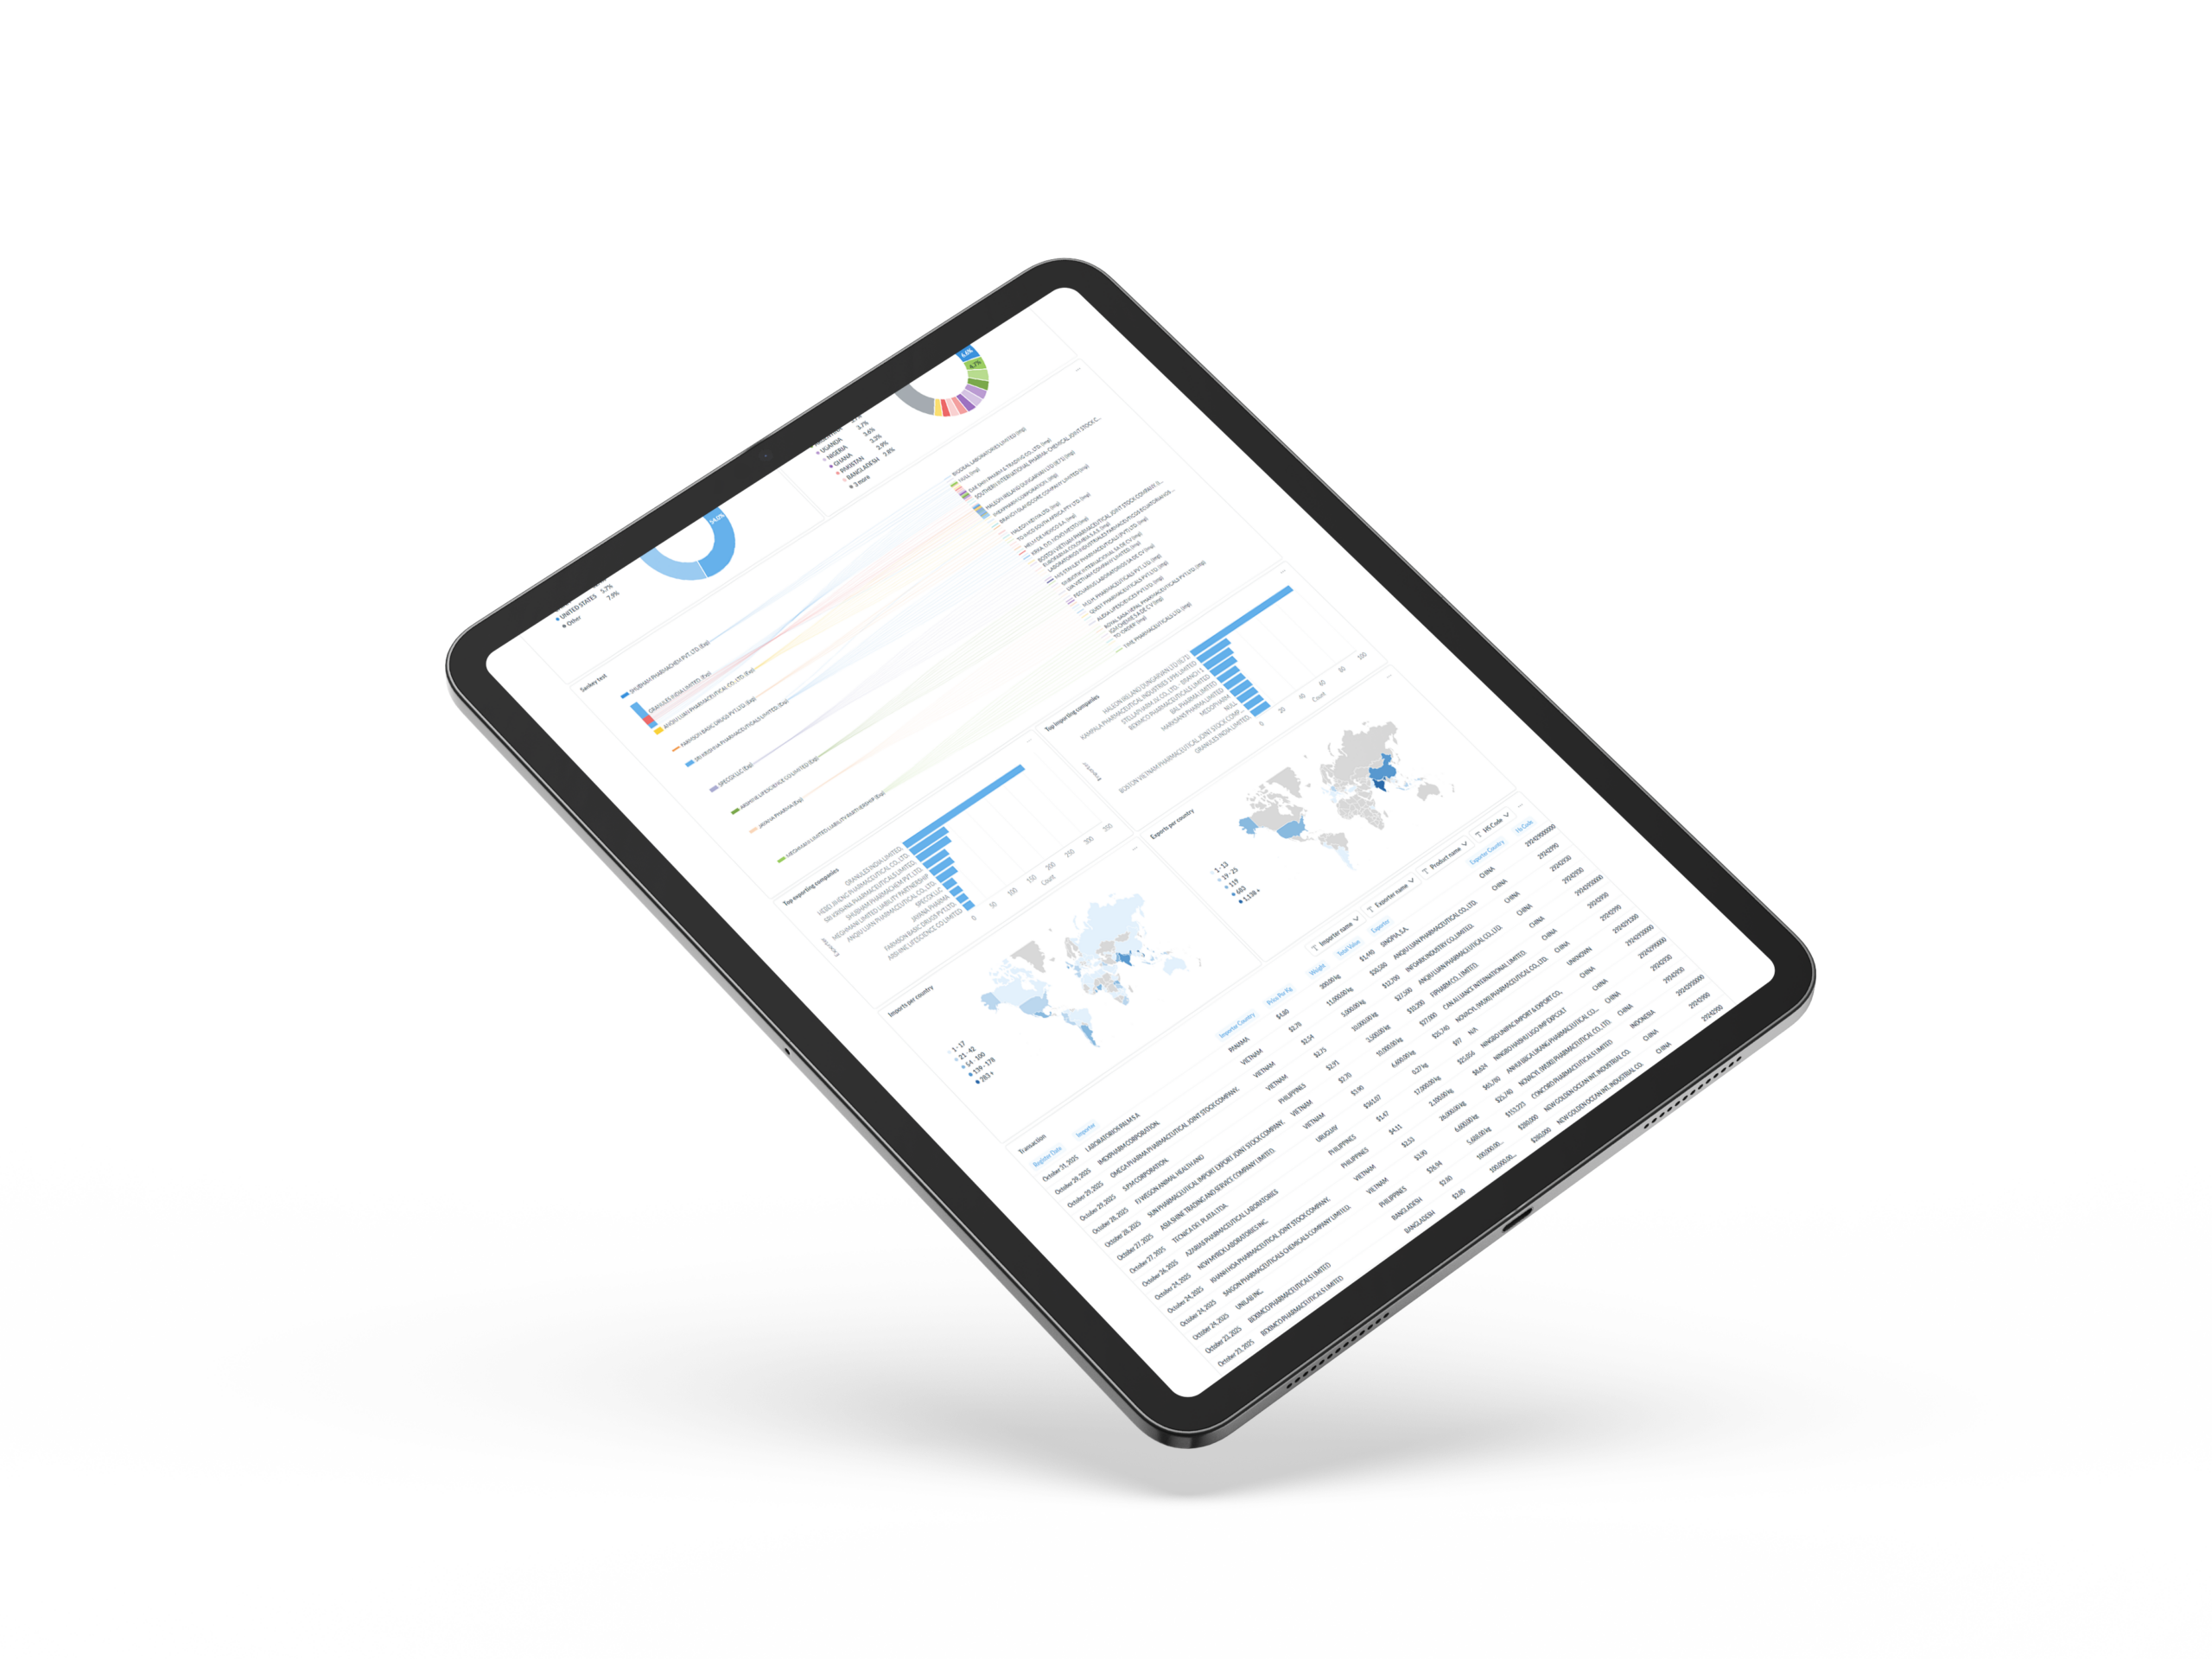
Analytics dashboard
Interactive charts and structured insights in one place.
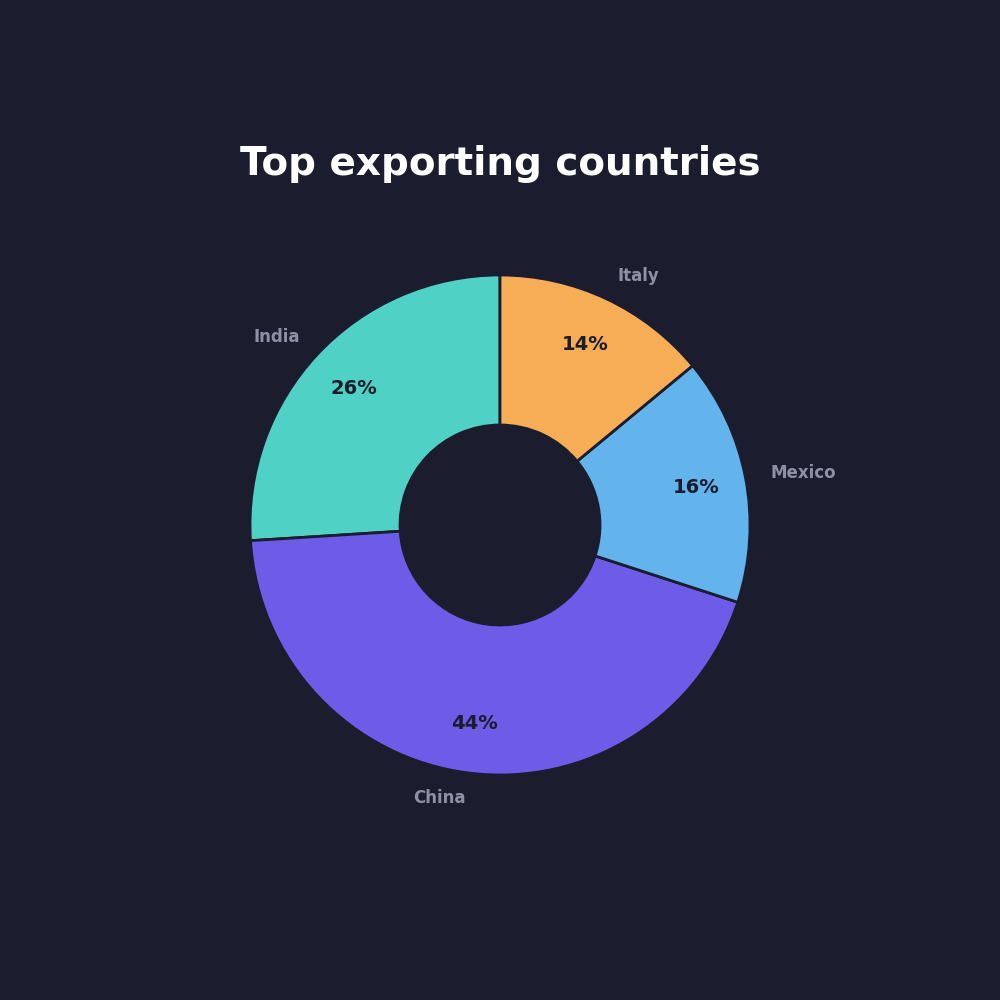
Price benchmarks
Average API prices per kg across markets and origins.
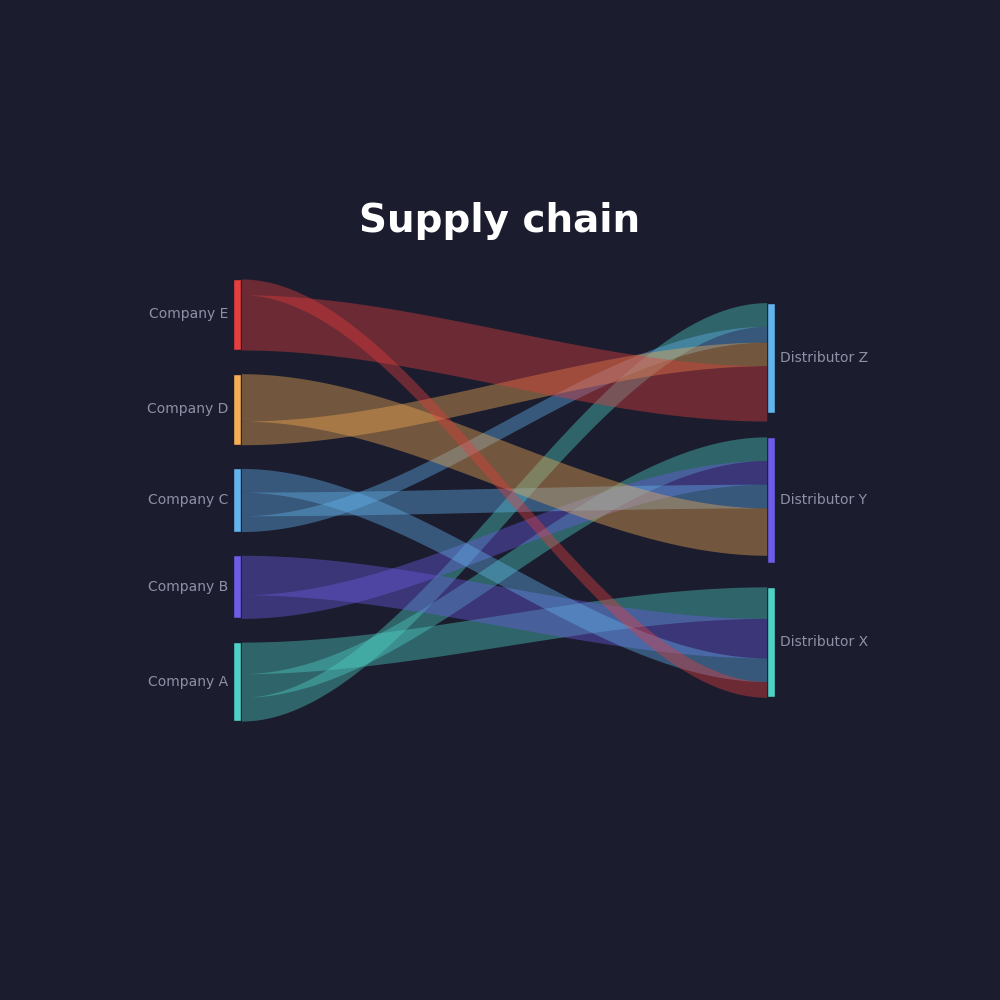
Transaction insights
Real API transactions showing price/kg, quantities, and dates between companies.
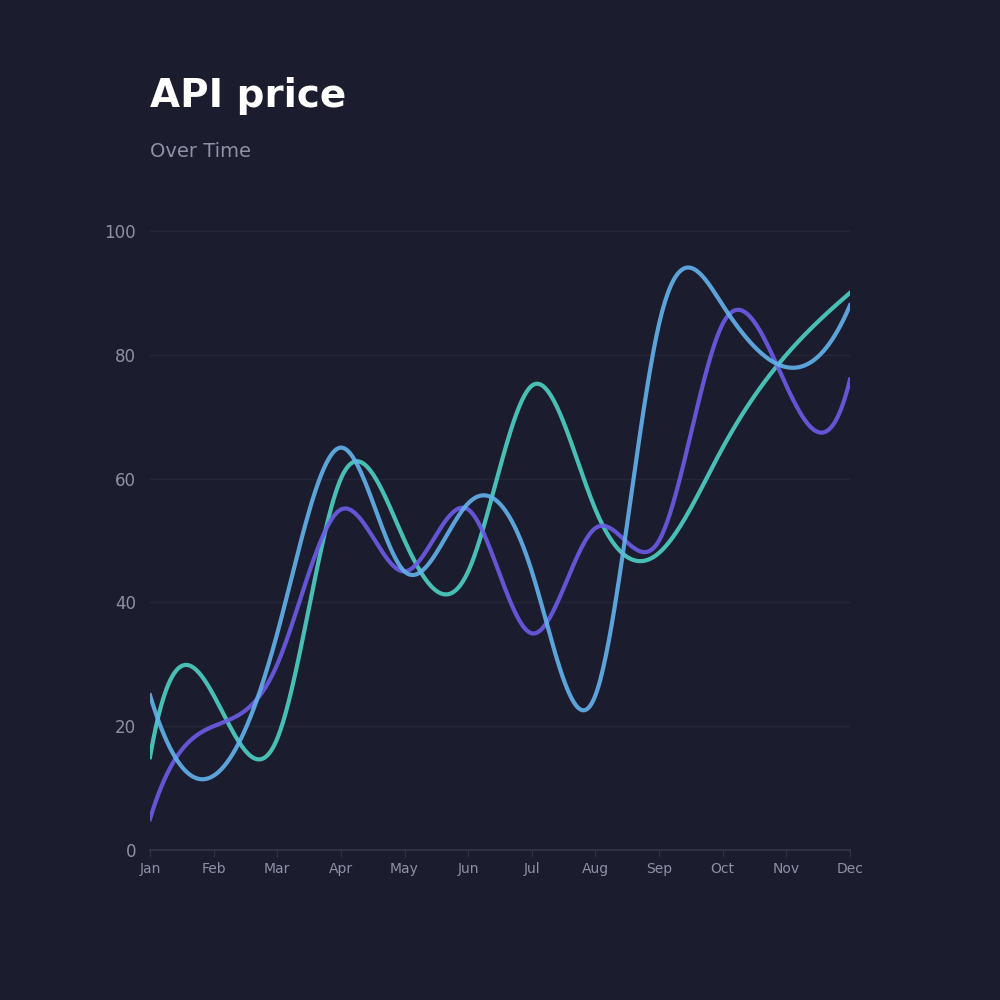
Historical trends
Price and volume developments over time.
How teams use this data
Benchmark supplier offers
Compare quotations against real market pricing before committing.
Prepare negotiations
Enter discussions with objective reference points and market context.
Support internal decisions
Use data to justify sourcing choices to management, QA, and finance.
Monitor market movements
Track pricing and volume trends to anticipate changes over time.
How the data is built
Pharmaoffer sourcing intelligence is built from external market data that is cleaned, merged, and structured by our team for pharmaceutical sourcing use cases. The result is consistent, API-specific insight designed to support benchmarking and decision-making.
Access the data
Pharmaoffer sourcing intelligence is available through a subscription, with access options designed for different sourcing needs and team sizes. You can explore the data, discuss your use case, and choose the right setup with our team.
Core
€0
Compare, connect, and source with confidence.
- Full supplier transparency
- Unlimited API searches
- Unlimited inquiries
- Inquiry message board
- Side-by-side supplier comparison
Pro
€249
Monthly subscription. Save 15% with the yearly plan.
- Total market transparency
- Supplier trade data access
- Buyer/supplier flow comparisons
- Unlimited price & transaction insights
- Dedicated Pharmaoffer support
FAQ
- See the average API prices. Filtered by country or quantity.
- Compare prices of your top APIs with the industry’s standard.
- Benchmark to set your selling prices in the global market.
- Find new clients by discovering companies that purchase from your competitors.
- Know what your competitors sell and for how much.
- Identify the APIs and companies your clients are purchasing from.
- Track trends and monitor price changes throughout the year.
- API prices by country and quantity
- Global transaction history
- Buyer and supplier names
- Competitor activity
- Trends and benchmarks
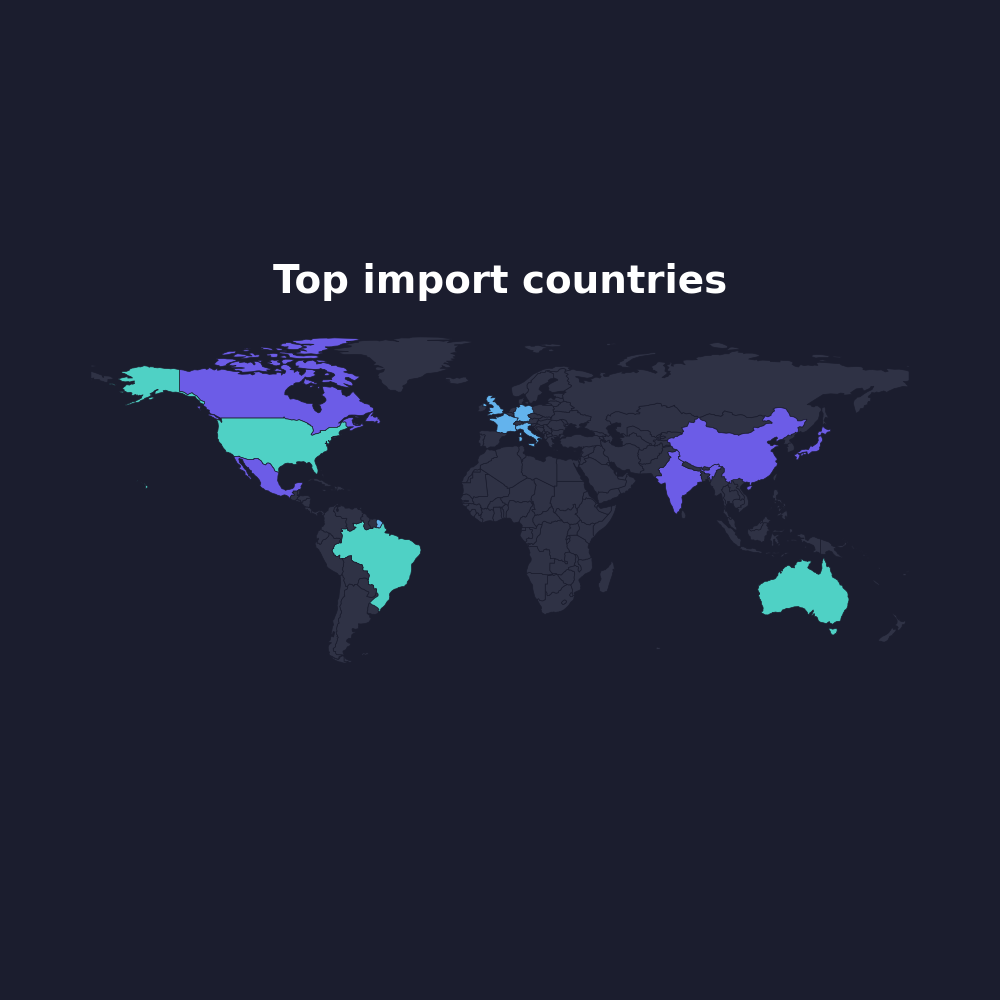
Our data is sourced from certified API suppliers and government verified industry transactions. We gather real-time information directly from the global pharmaceutical market, ensuring that the insights you receive are accurate, up-to-date, and reliable.
The data contains customs and shipping information from multiple countries and covers over 180 regions worldwide.
Different countries have their own strict regulations and limitations on sharing trade information due to varying customs rules.
The 40 countries we have data from are:
- North America: United States, Mexico, Panama, Costa Rica
- South America: Colombia, Chile, Brazil, Ecuador, Paraguay, Uruguay, Peru, Argentina, Venezuela
- Asia: Philippines, Vietnam, Indonesia, Uzbekistan, Kazakhstan, Pakistan, Sri Lanka, Bangladesh, India
- Europe: Ukraine, Russia, United Kingdom, Turkey
- Africa: Ethiopia, Uganda, Kenya, Liberia, Lesotho, Côte d’Ivoire, Botswana, Namibia, Central African Republic, Nigeria, Cameroon, Chad, Ghana, Tanzania
Yes, you can cancel your subscription at any time. However, please note that you will continue to have access to your selected plan’s features until the end of the current billing cycle.