Talniflumate API price and transactions
Accurate pricing comparisons across thousands of APIs
About our data
Our trade database includes data from 3 exporters (suppliers) and 4 importers (buyers), providing insights into Talniflumate ingredient average pricing, transaction volumes, and market trends over the last five years, crucial for pharmaceutical companies to optimize procurement, benchmark pricing, and identify key players.


1. China, 2. United States, 3. Korea
Top Leading Supply Countries

1. Vietnam, 2. India, 3.
Top Purchasing Countries
Unlock detailed pricing and quantity data by starting your free trial or subscribing today.
Register to start Pricing & More Info
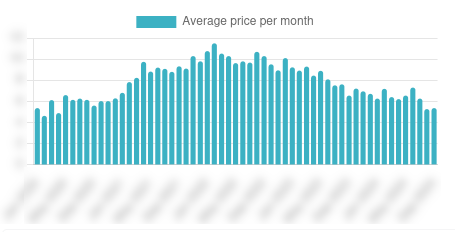
What is the current average price of Talniflumate API per kilogram?
The current average price of Talniflumate is [Data available to subscribed users] USD per kilogram, based on recent transaction data collected from [Data available to subscribed users] transactions over the past year.
Which countries are the main suppliers of Talniflumate ingredient?
The primary supply countries for Talniflumate include China, United States and Korea. These countries are significant contributors to the global supply, offering quality products and competitive pricing.
How can I access detailed trade data for Talniflumate?
By subscribing to our Trade Data Packages, you gain full access to detailed transaction histories, pricing trends, supplier information, and global trade analytics for Talniflumate and thousands of other APIs.
Average price per kilo
$ @36$-7!
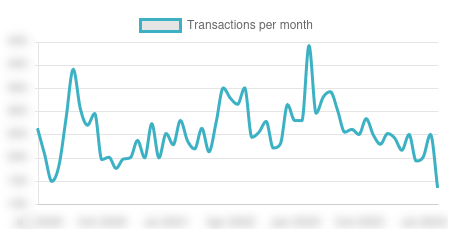
Number of transactions
$ @36$-7!
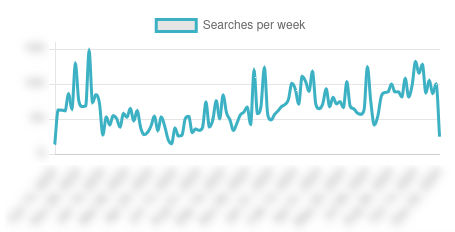
Pharmaoffer searches
$ @36$-7!


In-Depth Analysis of Talniflumate Global Trade Dynamics
Understanding the trade dynamics of Talniflumate is essential for stakeholders in the pharmaceutical industry. Our data covers export and import trends, pricing fluctuations, and market demand across 5 countries and 3 continents.
Export and Import Trends:
Top Exporters: China, United States and Korea dominate global Talniflumate exports.
Major Importers: Key purchasing countries include Vietnam and India, reflecting the global demand for Talniflumate.
Market Demand and Search Trends:
[Data available to subscribed users] searches for Talniflumate have been recorded on Pharmaoffer, indicating a strong interest and demand in the market.By analyzing this data, pharmaceutical companies can:
Optimize Procurement Strategies: Identify the best sources for Talniflumate based on price and supplier reliability.Benchmark Pricing: Compare your purchase prices with industry averages to ensure competitive positioning.
Monitor Market Trends: Stay informed about market fluctuations to make proactive business decisions.
Talniflumate active pharmaceutical ingredient ( CAS Number: 66898-62-2, UNII: JFK78S0U9S, ) is a crucial type of Anti-inflammatory Agents widely utilized in pharmaceutical manufacturing. Pharmaoffer provides detailed trade data analytics for Talniflumate API to help you gain a competitive edge in the global market.

